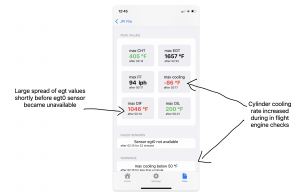
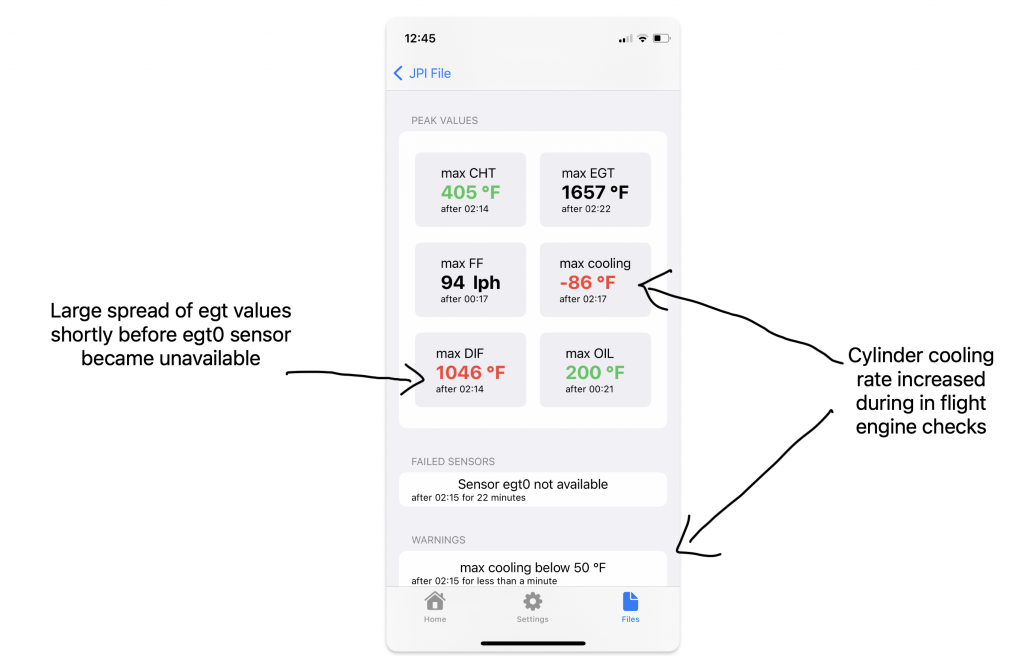
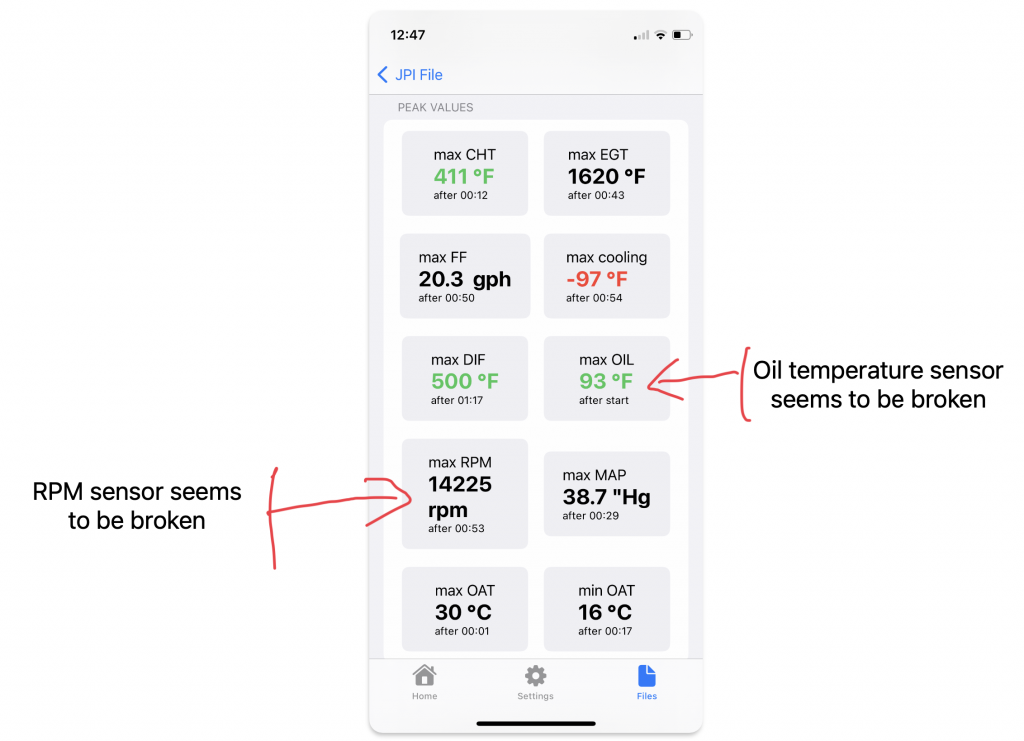
With BlueEDM version 1.6, which is now available in the App Store, you can integrate a review of your flight’s engine monitoring data into your regular flight de-briefing. It shows peak values of the most important sensor values and if for a sensor an alarm limit was exceeded during flight, it will show this peak value in red color. More generally BlueEDM will show all times during flight, when these limits were exceeded. Finally, BlueEDM will show failed sensors, directly in a flights overview screen. Prior versions only made failed sensors available in the JSON export of a flight.
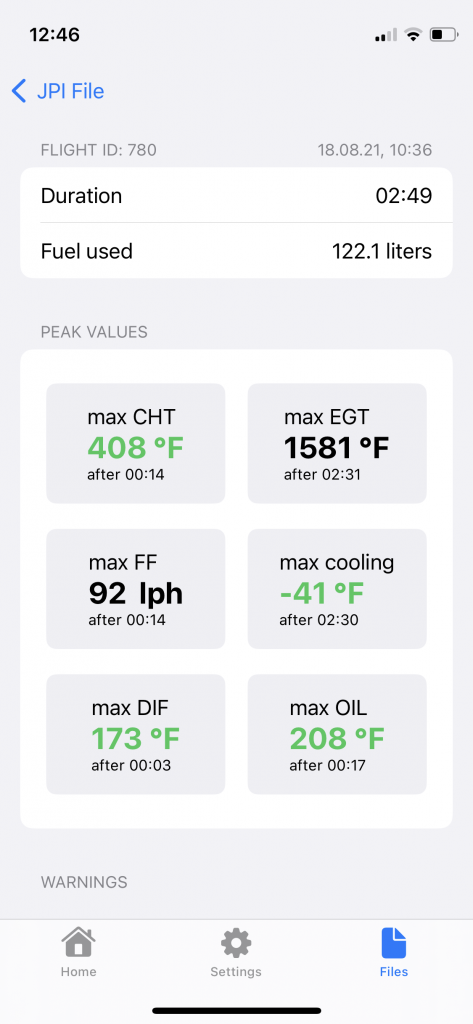
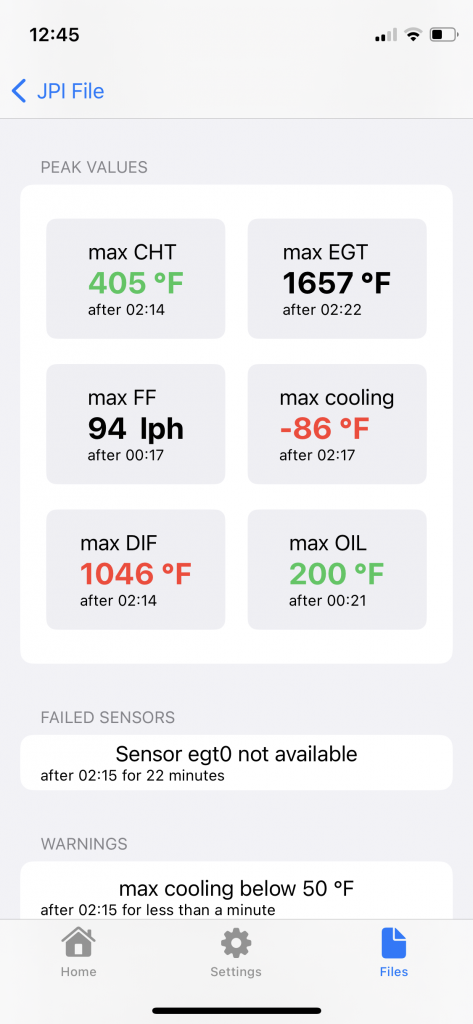
These features make BlueEDM a valuable tool to decide post flight, whether your aircrafts engine has a problem or whether certain irregular monitoring values were just due to failed measurement equipment. This decision might be the decision between flying or not flying.
Using BlueEDM and a serial to Bluetooth adapter you can easily download the engine data to your iPhone directly after each flight and then:
- As a pilot, review your flight, fuel usage, available alarms and other data points to improve you flying skills and keep your airplanes engine healthy.
- As an aircraft owner, you may use BlueEDM to check whether a pilot renting your plane treated it properly (CHTs within limits, no turbo overboost, …). You may even check fuel usage during a flight (if FF is installed as part of the EDM700 installation) and use it for charging the rental fairly.
- As a flight instructor you may use it to train your students on how to avoid behaviors that may harm the engine.
With BlueEDM’s export options you may then upload your engine’s monitoring data with popular and more sophisticated tools like SavvyAviation or Engilytics for in-depth and longterm analysis
Whats new with BlueEDM version 1.6:
- Support EDM800 and EDM830 device versions (with only limited test points)
- Improved handling of units of measurement. Units will also be part of the JSON export of a file or flight
- If a sensor is unavailable during parts of flight, a corresponding warning is displayed
- Display max MAP, max OAT, min OAT, max FF and max RPM, if sensors are supported by the installation
- New display of peak values:
- if a sensor value has a corresponding alarm threshold, display peak in red if it exceeds the limit, green otherwise
- if no alarm threshold is existent, display the peak value in the primary color
